Macro regime
Regime scoring with conviction, asset map, and invalidation levels.
Platform
ZinsCapital connects top-down regime analysis, security research, portfolio risk, systematic and derivatives analytics, and an AI research layer, so the context follows the decision.
A - Macro Intelligence
Growth, inflation, policy, credit, liquidity, rates, FX, and commodities organised around the decisions they inform.
Regime scoring with conviction, asset map, and invalidation levels.
Headline, core, breadth, contribution, and expectations.
Central-bank balance sheets, money, and impulse.
Policy paths, real yields, breakevens, and curve regimes.
Dollar cycle, carry, differentials, and funding stress.
Cycle, curves, spreads, inventories, and macro sensitivity.
B - Security Research
Research securities with the macro regime, sector, factor, positioning, and market structure still visible.
Statements, valuation, peers, quality, and earnings context.
Customer, supplier, and competitor graphs drawn from filings.
Multi-chart workspaces, indicator library, and auto-drawn structure.
Value, quality, growth, momentum, and relative strength.
Futures positioning, z-scores, sentiment, and extremes.
Participation, leadership, sector rotation, and confirmation.
C - Portfolio & Risk
See what the portfolio owns economically, how the regime can reach it, and what changes under a scenario.
Asset, sector, factor, currency, and macro sensitivity.
Historical behavior across comparable macro states.
Rate, inflation, growth, volatility, and correlation shocks.
Events, alerts, watchlists, drawdown, and thesis conditions.
D - Systematic & Derivatives
Specialised analytics layers sit on top of the core workflow. We describe them at the category level here — the full toolset is visible inside the terminal.
Trend, carry, and crowding across the global futures complex.
Fitted surfaces, forward vol, shadow Greeks, and hedging structure.
Historical patterns and statistical tendencies as research context.
Scripting, custom indicators, and historical strategy testing.
E - AI & Automation
An assistant and a set of research agents sit inside the workflow, primed with the live regime call and the current tape. They run on the model provider you connect in Settings — a free tier, Qwen, your own self-hosted endpoint, or a paid Anthropic/OpenAI key. No vendor markup, and no prompts used for model training.
Streaming chat on every page, aware of the active regime and headlines.
Scenario scoring and first-, second-, and third-order read-throughs per print.
Plain-language strategy to specification, deterministic backtest, and report.
Impact-classified news and relationship graphs pulled from primary filings.
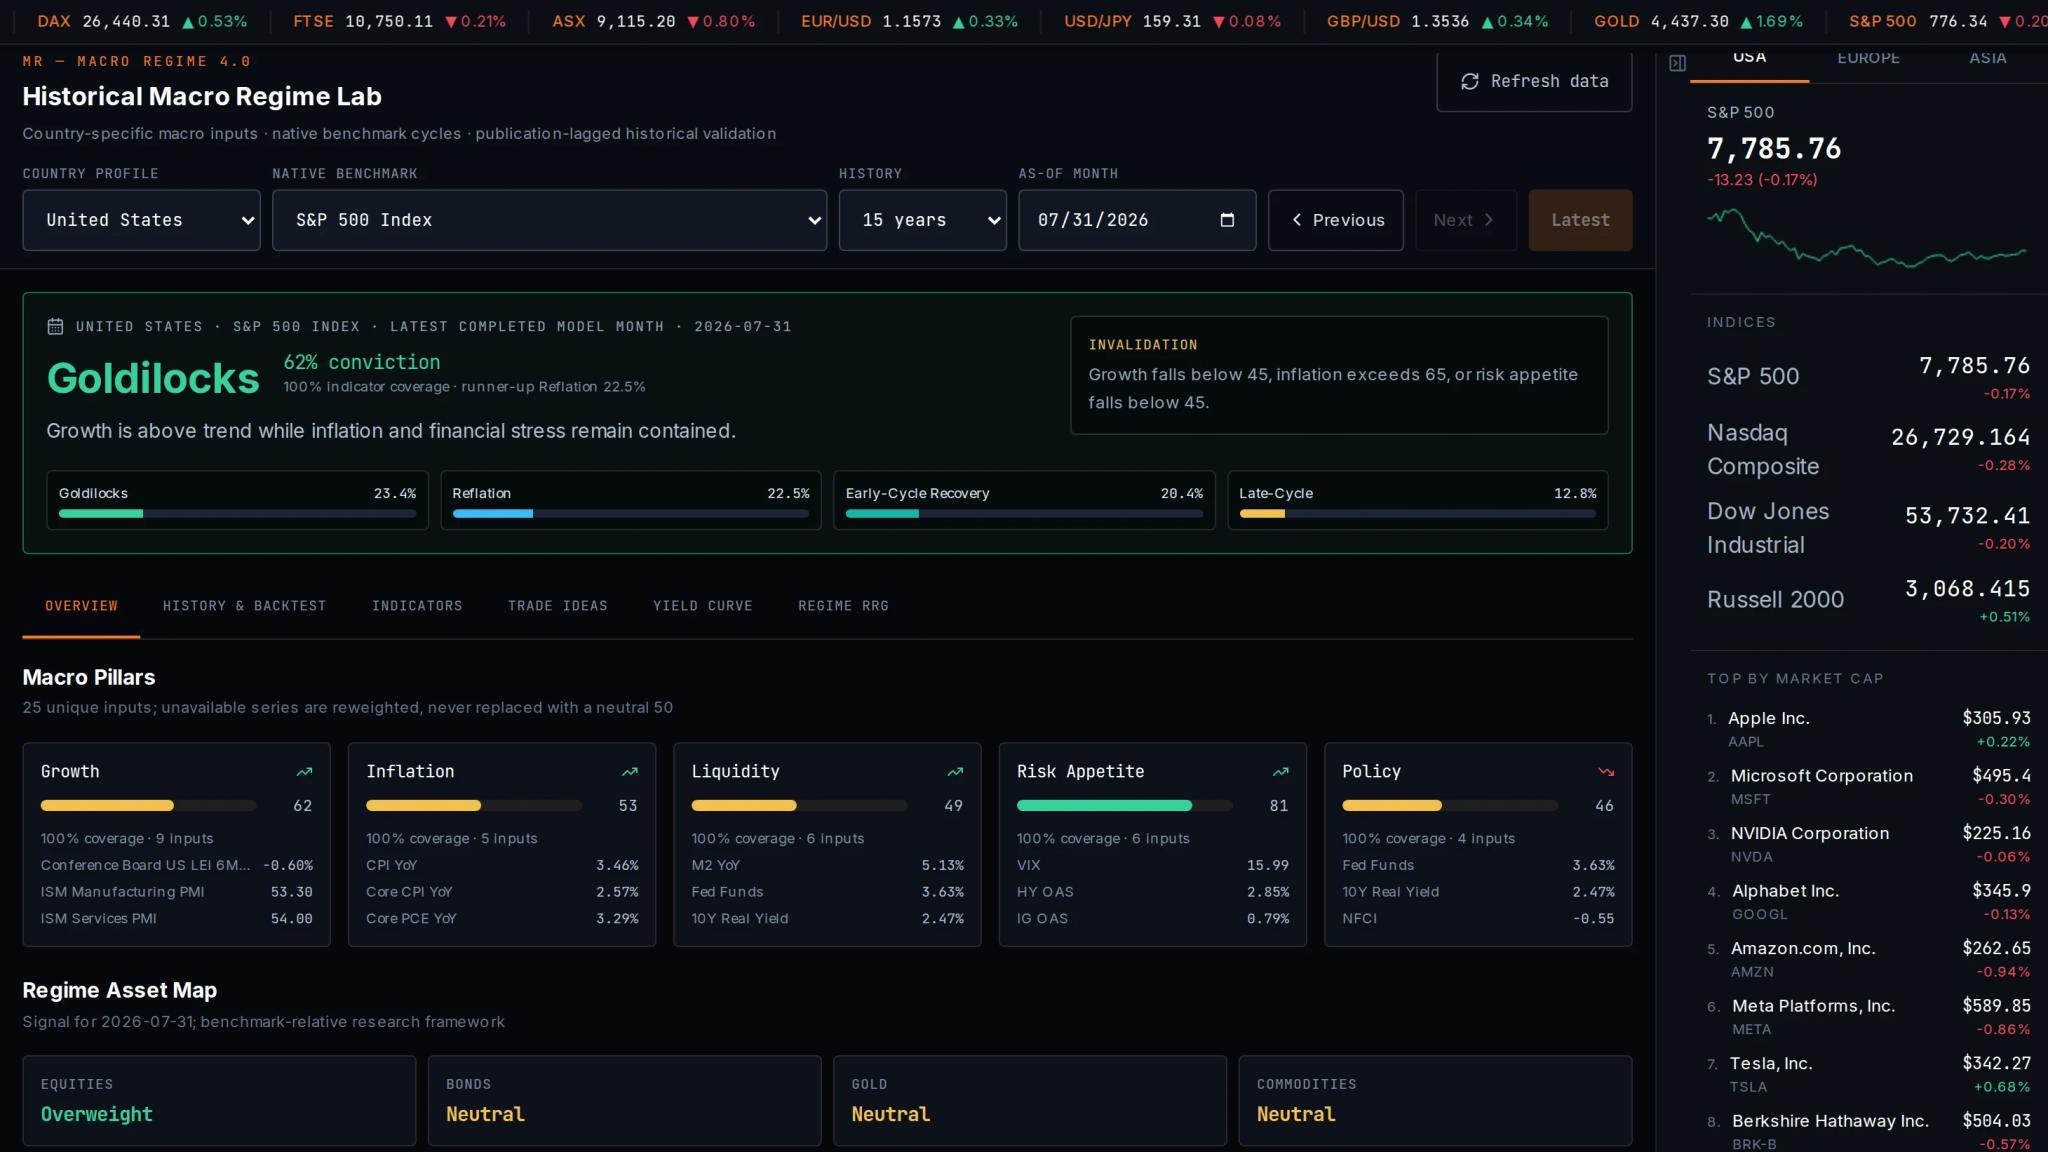
Macro Regime
Growth, inflation, policy, liquidity, and risk appetite scored into one regime call, with the asset map it implies and the conditions that would break it.
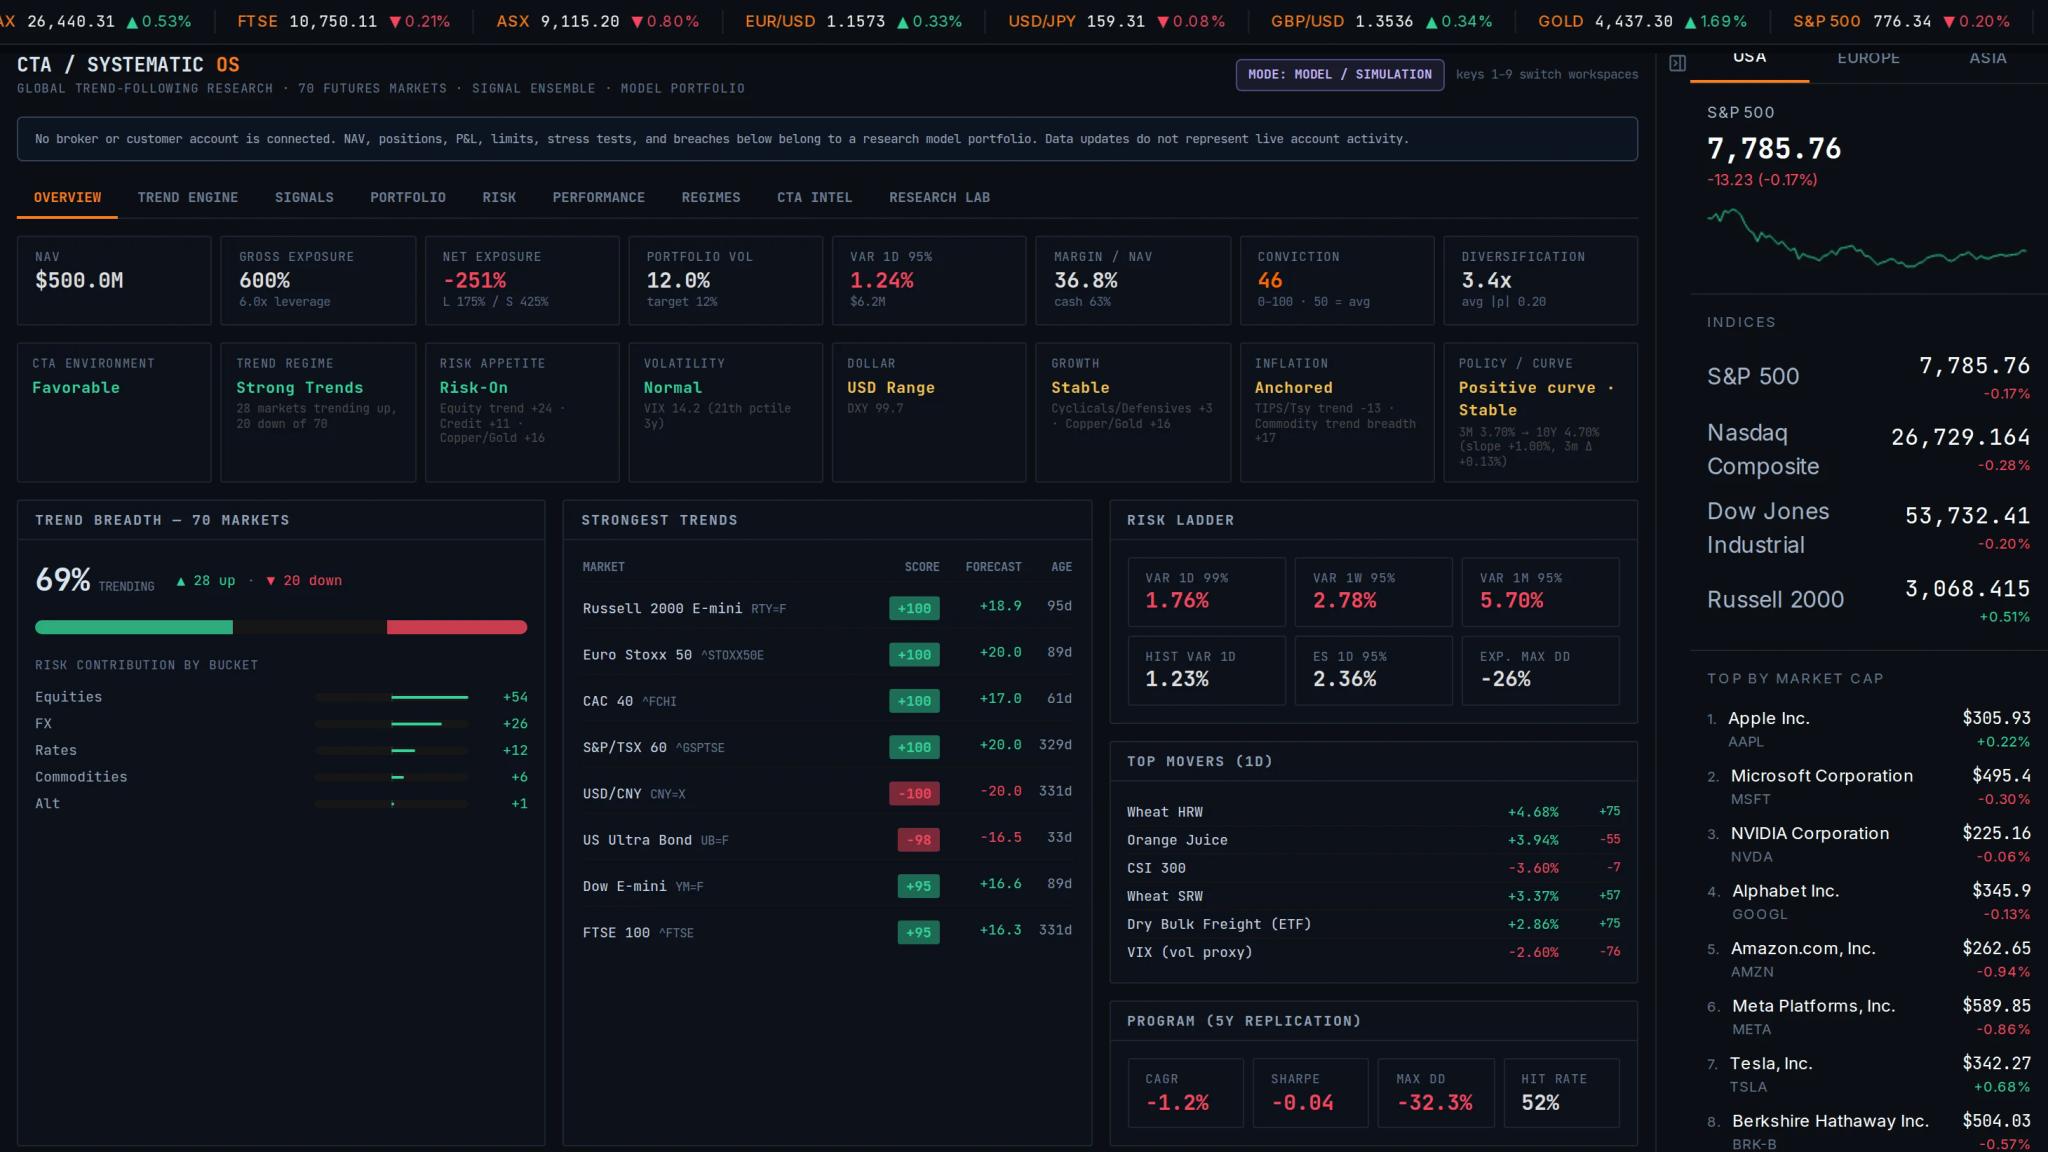
Systematic OS
Signal ensemble, model portfolio, and risk ladder across 70 futures markets, with crowding diagnostics and replication analytics against the managed-futures industry.
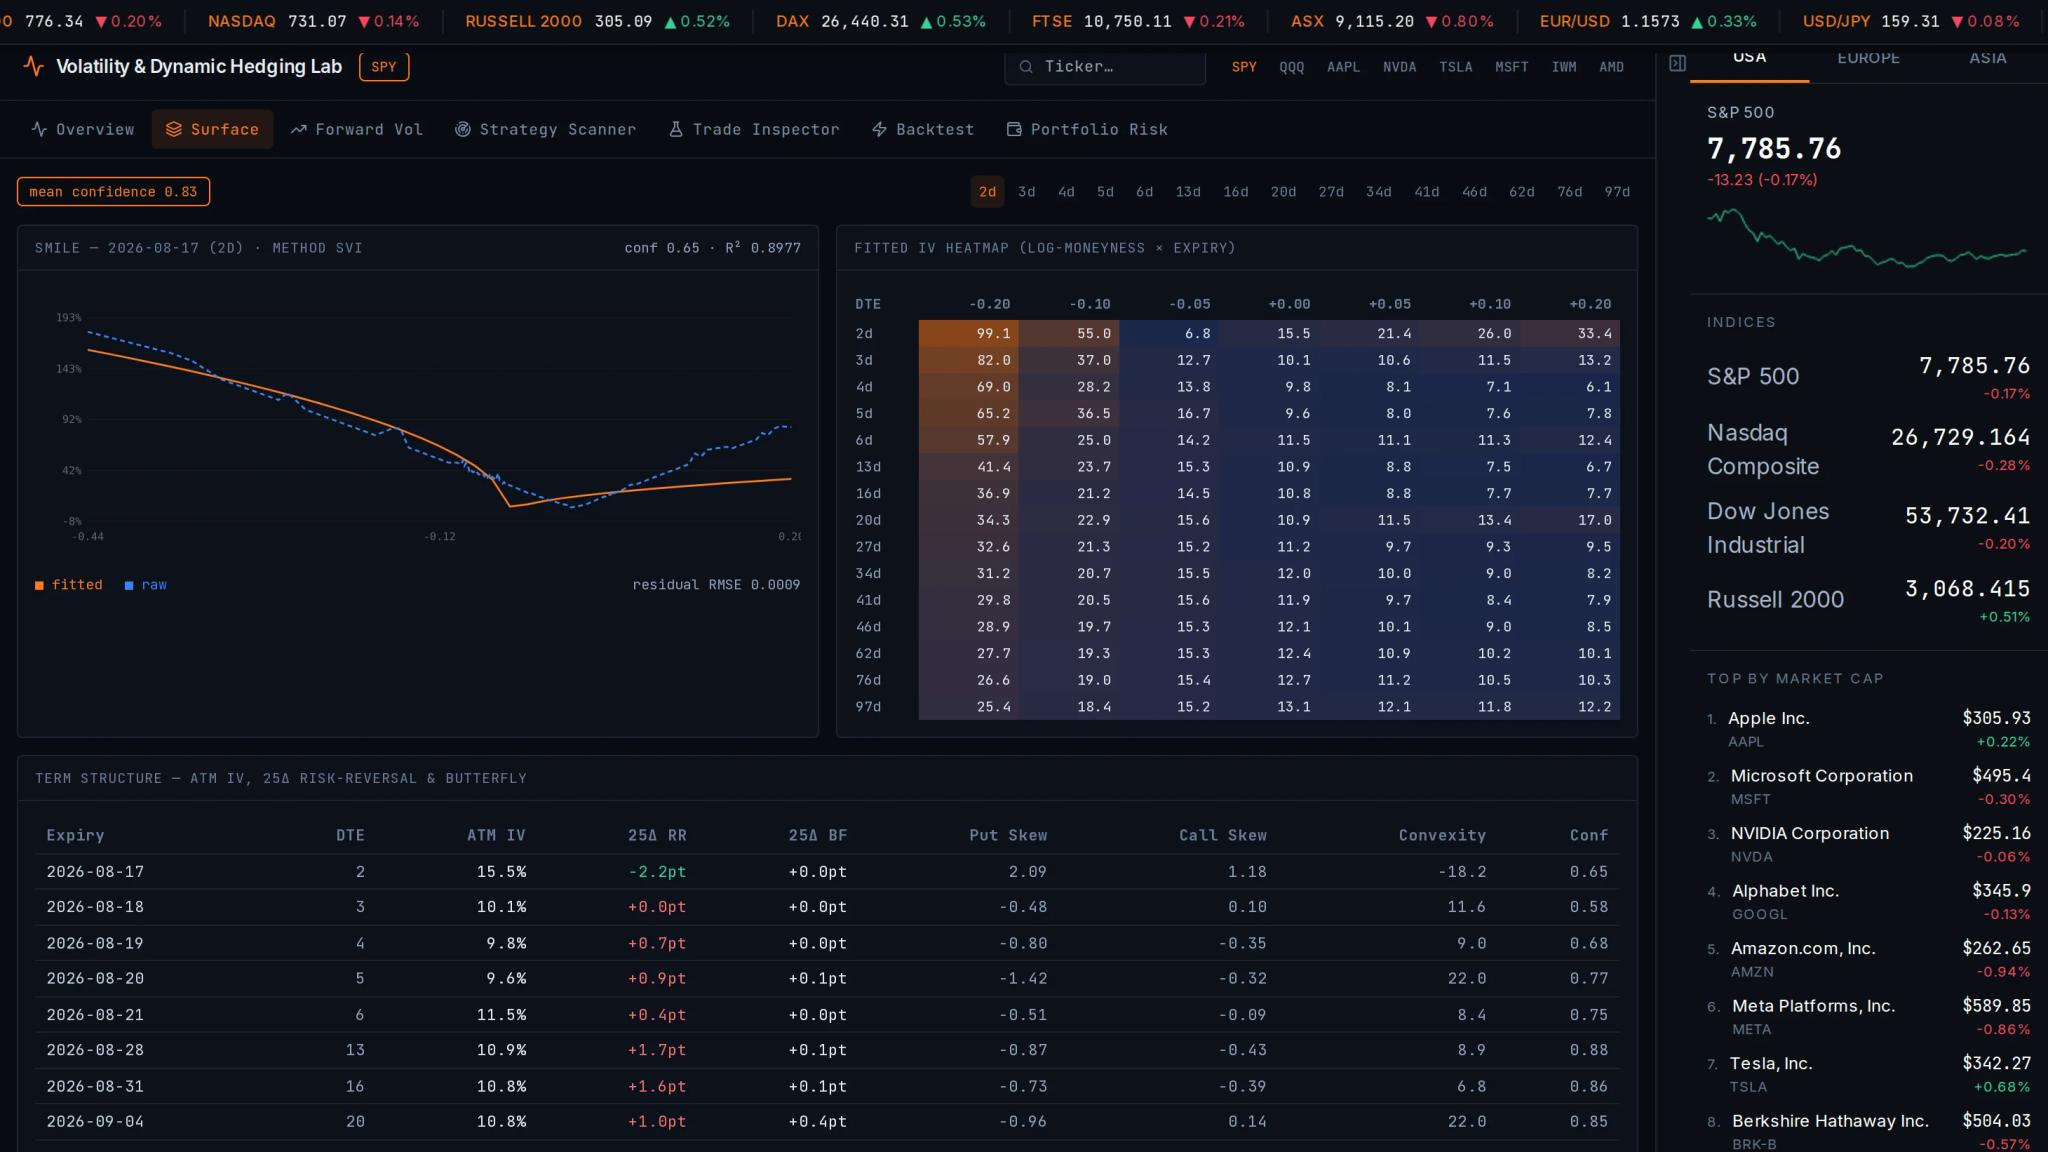
Volatility Lab
A fitted volatility surface with term structure, skew, forward vol, and shadow Greeks — the hedging desk's view of an underlying rather than a single option chain.
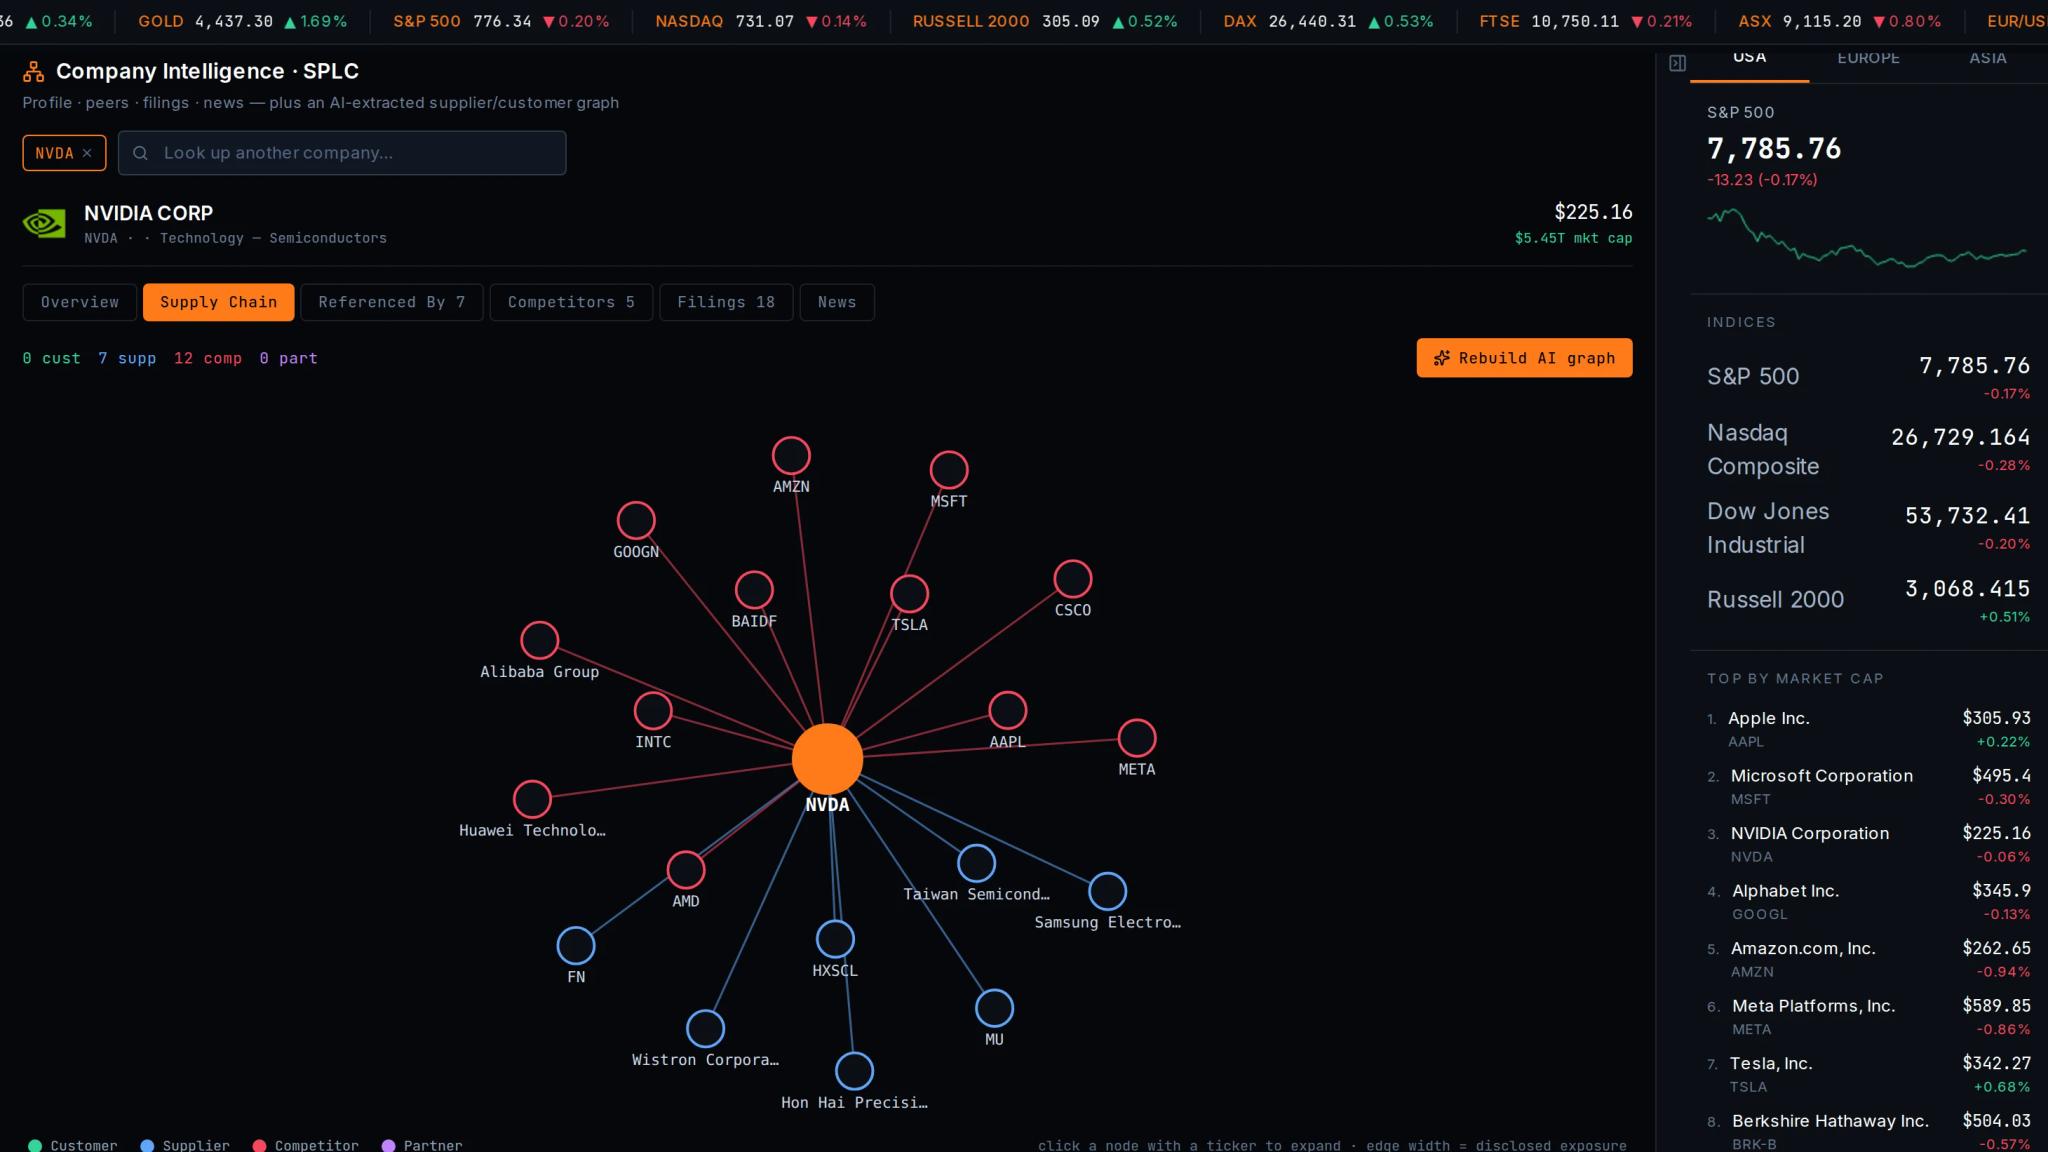
Company Intelligence
Customers, suppliers, and competitors extracted from primary filings into one graph, so a print or a policy change can be followed to the names downstream of it.
The complete catalogue as the terminal's own registry defines it, with the plan that unlocks each one and whether it is finished.
58 modules: 45 available, 4 with no live data behind them, 1 built but waiting on a data subscription, and 8 still in development. The unfinished ones are listed rather than hidden — the plan you would be paying for should not be a surprise.
| Code | Module | Plan | Status |
|---|---|---|---|
| Command Center | |||
| ALRT | Alerts | Portfolio | Available |
| N | Live News Tape | Macro | Available |
| PORT | Portfolio & Risk Analytics | Portfolio | Available |
| PC | Portfolio Command | Portfolio | Available |
| RISK | Risk Dashboard | Portfolio | Available |
| HOME | Terminal Home | Free Macro Pulse | Available |
| TJ | Trade Journal | Portfolio | Available |
| WL | Watchlists | Macro | Available |
| WM | Wealth Management | Portfolio | Available |
| Macro Research | |||
| ALT | Alternative Data | Professional | In developmentPlaceholder — not usable yet |
| BANK | Bank Reports | Professional | In developmentPlaceholder — not usable yet |
| BC | Business Cycle | Macro | Available |
| CAL | Calendar | Macro | Available |
| COT | COT Reports | Professional | Available |
| EI | Economic Indicators | Macro | Available |
| FXM | FX Macro Model | Professional | Available |
| MR | Macro Regime | Professional | Available |
| MAP | Maps | Macro | Available |
| RF | Rate Forecast | Macro | Available |
| RRG | Rel. Rotation Graph | Professional | Available |
| SEAS | Seasonal Analysis | Professional | Available |
| SSCR | Seasonal Screener | Professional | Available |
| SECT | Sector Rotation | Professional | Available |
| Equity Intelligence | |||
| 13F | 13F Data | Professional | Available |
| EA | AI Earnings Agent | Portfolio | Available |
| CORR | Correlation | Professional | Available |
| GOV | Gov Tracker | Professional | In developmentPlaceholder — not usable yet |
| LS | L/S Equity | Portfolio | Available |
| MP | Modell Portfolio | Professional | Available |
| RES | Research Reports | Professional | Available |
| RPROB | Return Probability | Professional | Available |
| DES | Stock Overview | Macro | Available |
| SCR | Stock Screener | Macro | Available |
| VAL | Stock Valuation | Professional | Available |
| SPLC | Supply Chain | Professional | Available |
| TA | Technical Analysis | Macro | Available |
| Strategy Workspaces | |||
| CMD | Commodities | Professional | Available |
| CRD | Credit | Professional | In developmentPlaceholder — not usable yet |
| CTA | CTA / Systematic | Portfolio | Available |
| ED | Event-Driven | Portfolio | In developmentPlaceholder — not usable yet |
| FND | Fund Analyzer | Portfolio | Available |
| MS | Multi-Strategy | Portfolio | In developmentPlaceholder — not usable yet |
| OPT | Options & Vol | Portfolio | Available |
| PWR | Power & AI Load Desk | Professional | Available |
| PM | Prediction Markets | Portfolio | Available |
| RV | Relative Value | Portfolio | In developmentPlaceholder — not usable yet |
| VOL | Volatility Lab | Portfolio | Available |
| Execution | |||
| EXEC | Execution Desk | Portfolio | No live dataThe screen works; nothing on it is a live feed |
| PTA | Personal Trading Agent | Portfolio | Available |
| LAB | Strategy Lab | Portfolio | No live dataThe screen works; nothing on it is a live feed |
| Knowledge | |||
| CALC | Calculators | Macro | In developmentPlaceholder — not usable yet |
| LIB | Research Library | Portfolio | No live dataThe screen works; nothing on it is a live feed |
| SET | Settings | Macro | Available |
| Not on the command line | |||
| industry-map | Professional | Available | |
| macro-compare | Macro | Available | |
| workflow | Professional | Available | |
| workspace | Free Macro Pulse | No live dataThe screen works; nothing on it is a live feed | |
| world-data | Portfolio | Awaiting a data keyBuilt, but its provider subscription is not active yet | |
Your macro process, connected
Request access to the terminal, or speak with us about an institutional workflow.