Equity Intelligence · Identify opportunities
From the filing to the companies on the other side of it.
Screen about 20,000 listings, open a company's statements and segment revenue as reported, re-run its valuation on your own assumptions, and follow the suppliers, customers and holders around it.
Questions it answers
What a desk asks of it.
- Which names meet the screen, and what do their filings say beneath the ratio?
- Where does the revenue come from, by segment and by geography?
- What growth is the current price implying?
- When a supplier warns, which other companies are exposed, and who holds them?
What it includes
The modules in Equity Intelligence.
Each one is a working window in the terminal, opened by the code shown.
- SCR
Stock Screener
Descriptive, fundamental and technical filters over about 20,000 listings, with cross-listings de-duplicated.
- DES
Stock Overview
Profile, statements, estimates, filings and news. Segment and geographic revenue exactly as the company reports it.
- VAL
Stock Valuation
DCF and multiples with every input visible and editable. The growth rate implied by the current price is shown beside the fair-value estimate.
- SPLC
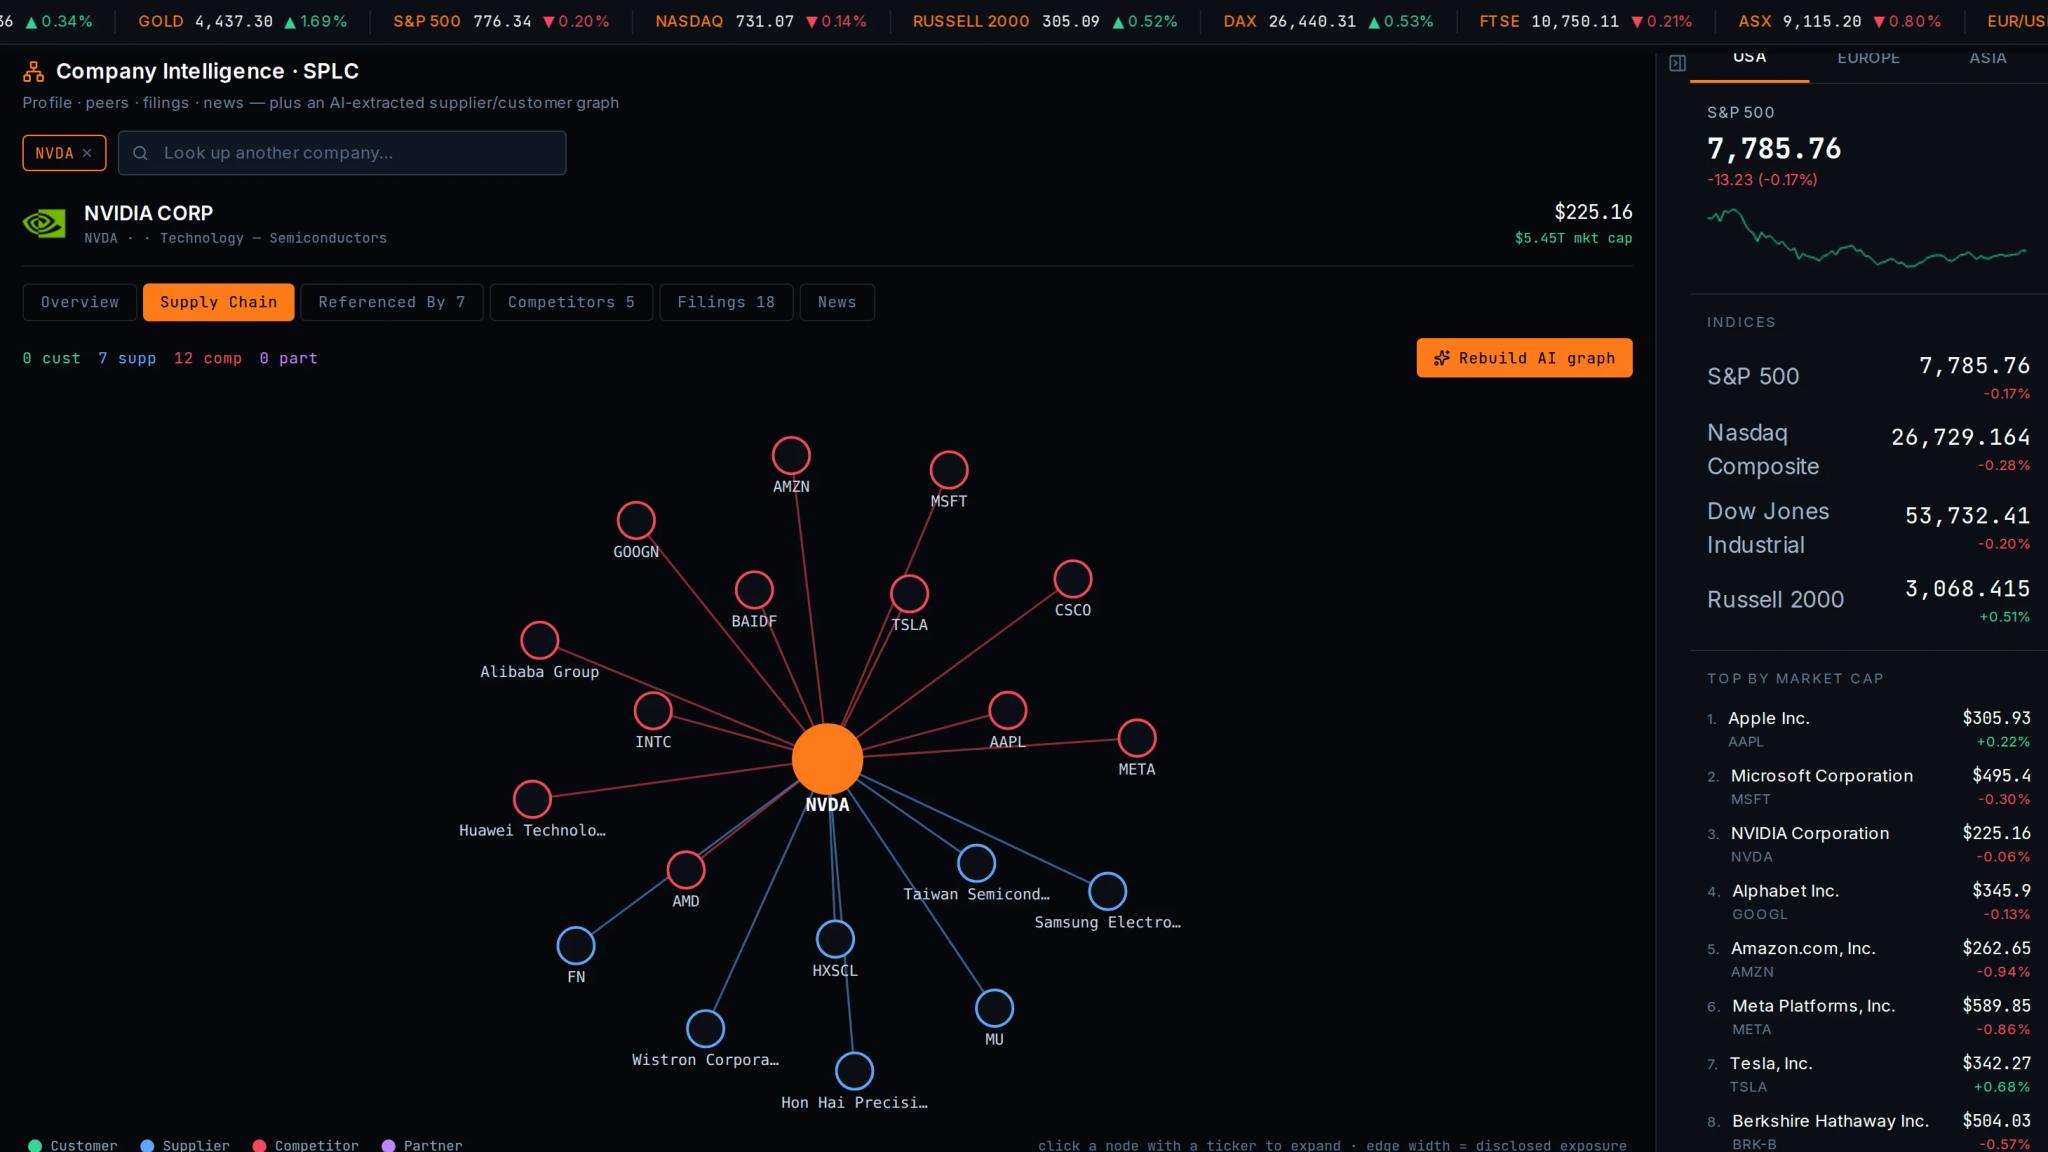
Supply Chain
Suppliers, customers, competitors and partners mapped from company filings, with the evidence kept on each relationship. A reverse lookup shows every company that names this one.
- 13F
13F Data
Institutional holdings, with holder overlap and crowding across a group of names.
- LS
L/S Equity
A fundamental health score built from growth, margins, return on capital, balance sheet and earnings quality, plus a red-flag scanner and pair assessment for long/short work.
- TA
Technical Analysis
Charting with 22 drawing tools, indicators on indicators, symbol expressions, bar replay and linked panels.
- EA
AI Earnings Agent
An AI earnings research agent that reads a print against pre-set scenarios and maps first- and second-order read-across.
Method
How the output is built.
- As reported
- Statement and segment data come straight from the company's own reporting, so every figure ties back to the filing it came from.
- Evidence on every relationship
- Each supplier, customer and competitor link carries the passage it was taken from, so the network can be checked in seconds.
- Valuation you can argue with
- The model shows its inputs and the growth the market price implies, instead of a single target.
What your team gets
The outcome, not the feature list.
- From a screen to a fully understood company in one workspace.
- Read-across from any filing or earnings print, mapped before the market prices it.
- Valuations your analysts can stress and defend, input by input.
Hedge Funds
Macro, long/short and systematic desks that need the regime, the read-across and the crowding in one place.
Family Offices
Small investment teams that need institutional research coverage without a room full of terminals.
Portfolio Managers
The daily loop: what changed, what the book is exposed to, and what would change the view.
Research Analysts
Filings, segment data, relationships and macro series that can be traced back to their source.
Request a demo
See it on your own questions.
A demo is a working session in the platform on a question you bring: a release, a company, a position or a portfolio. We reply within two business days.