Systematic Intelligence · Identify opportunities
Systematic signals, with the crowding and the evidence behind them.
Trend-following across 70 futures markets, sector rotation, seasonality, positioning, conditional return distributions and the volatility surface. Each is shown with how it is built, how crowded it is, and how much history supports it.
Questions it answers
What a desk asks of it.
- Which markets are trending, how old is the trend, and how crowded is it?
- What has historically followed this state, across the whole distribution rather than the mean?
- Is a correlation stable, or an artefact of the window?
- How is the options market pricing skew and term structure?
What it includes
The modules in Systematic Intelligence.
Each one is a working window in the terminal, opened by the code shown.
- CTA
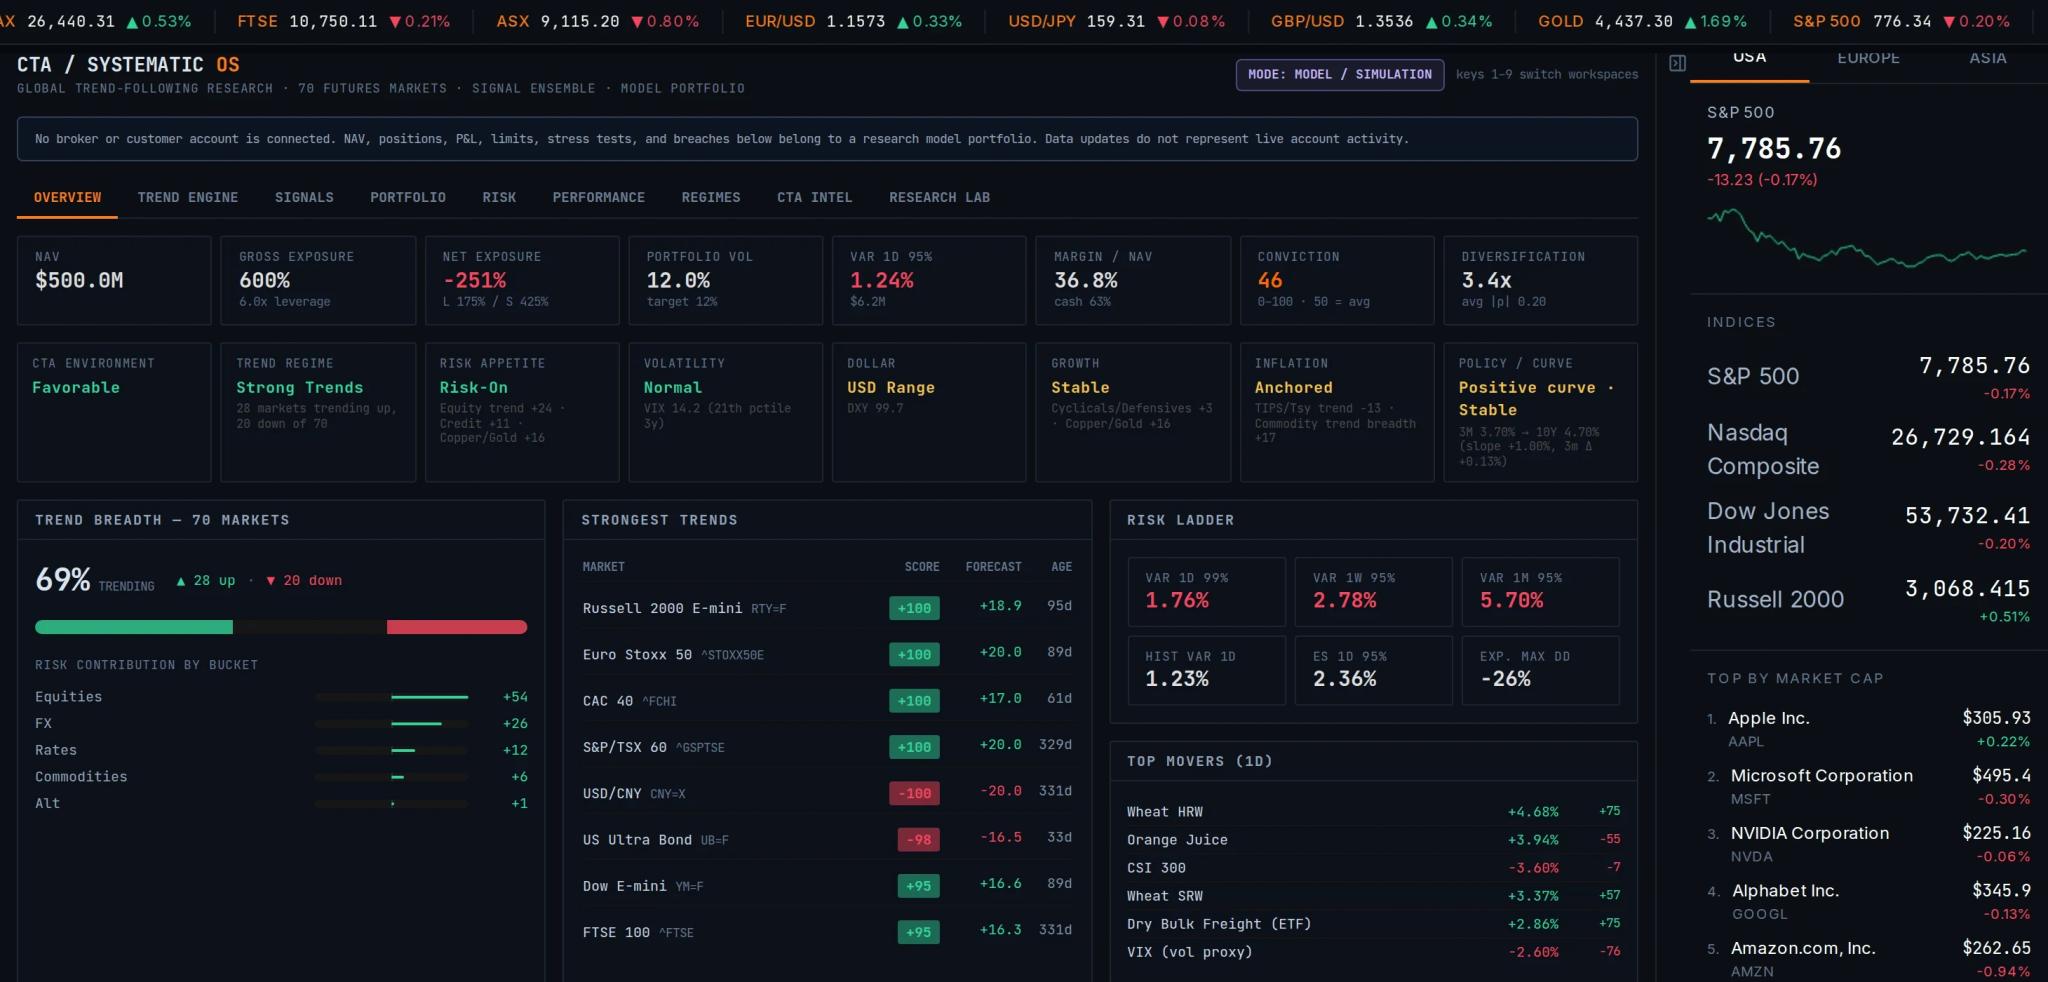
CTA / Systematic
A trend-signal ensemble across 70 futures markets, the macro environment it is operating in, a crowding read, and a model book with exposure, VaR, expected shortfall and stress.
- VOL
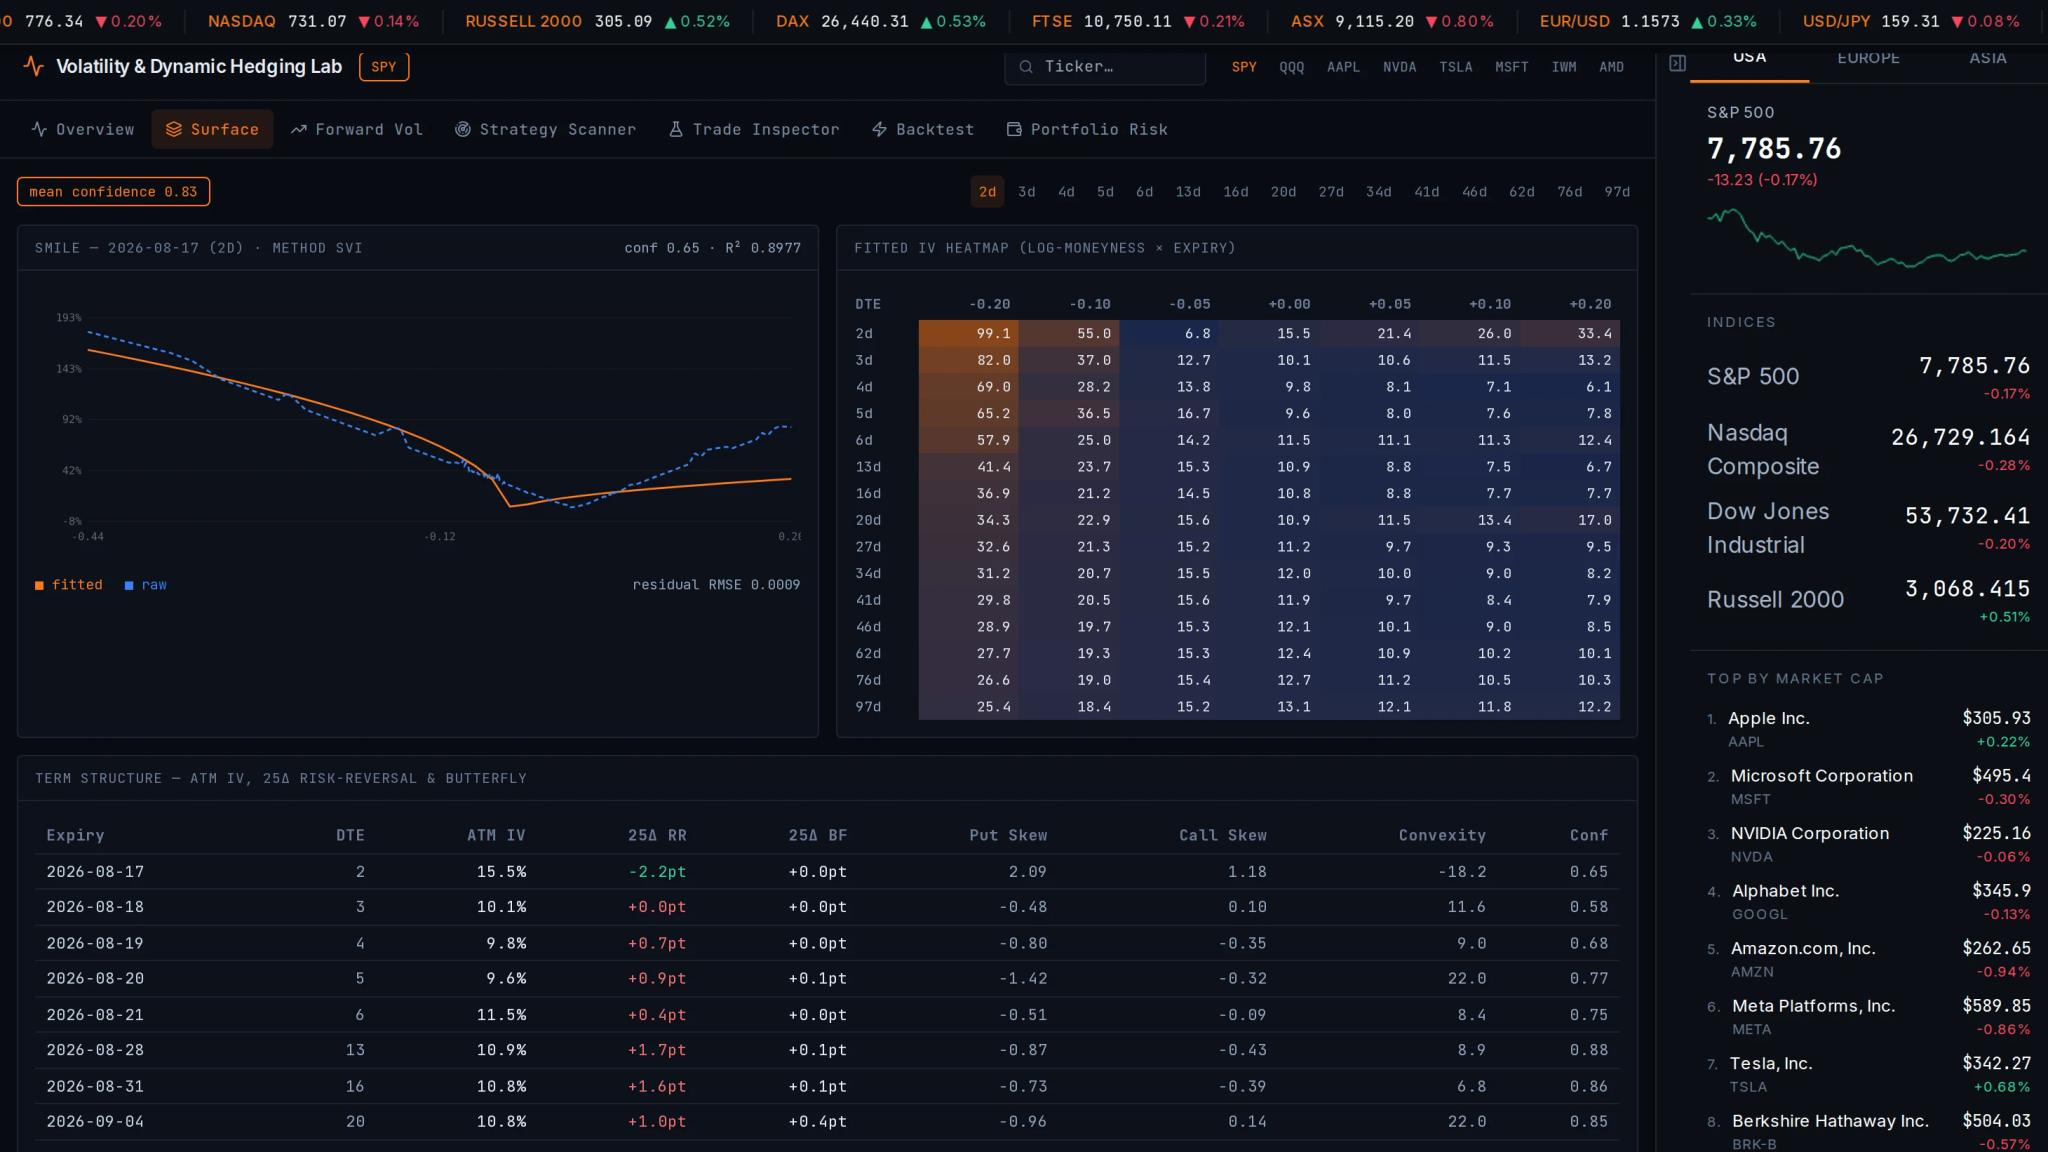
Volatility Lab
An SVI-fitted volatility surface with its fit statistics, forward volatility, a strategy scanner, a trade inspector, and a point-in-time backtest of option strategies.
- OPT
Options & Vol
Option chains, Greeks and implied volatility by strike and expiry.
- RPROB
Return Probability
The historical distribution of forward returns from a given state, with the depth of evidence beside it.
- CORR
Correlation
Rolling correlation and lead–lag across assets, with cross-exchange series aligned on trading dates.
- SECT
Sector Rotation
Sector rotation and relative strength across regimes.
- RRG
Rel. Rotation Graph
Relative Rotation Graphs for sectors, industries or your own tickers, against a benchmark you choose.
- SEAS
Seasonality
Seasonal profiles per instrument, and a screener for seasonal windows across a universe.
- COT
COT Reports
Futures positioning by trader category, normalised over the long history.
Method
How the output is built.
- Evidence next to every result
- Distributions and correlations print their observation count, so the team knows how much history stands behind each signal.
- Crowding next to the signal
- Trend and positioning are shown together, because the trade everyone holds behaves differently on the way out.
- Fit quality on the surface
- The volatility surface reports R², residual error and a confidence per expiry, so every expiry is read with the right weight.
What your team gets
The outcome, not the feature list.
- Trend, positioning and volatility for 70 futures markets on one screen.
- Entry and exit decisions informed by crowding, not just signal strength.
- Option structures chosen on a fitted surface rather than a quote screen.
Used by
Next: Portfolio & RiskHedge Funds
Macro, long/short and systematic desks that need the regime, the read-across and the crowding in one place.
Asset Managers
Research and allocation teams that need point-in-time macro inputs and benchmark-relative risk.
Risk Teams
A second, transparent view of portfolio risk, with every method and assumption visible.
Request a demo
See it on your own questions.
A demo is a working session in the platform on a question you bring: a release, a company, a position or a portfolio. We reply within two business days.